
STACK’s Estimate Worksheet is designed to work within a variety of workflows and give you the freedom and flexibility to generate estimates that capture the specific data you need.
When you create an Estimate Worksheet, it pulls all current project data to the estimate - even takeoffs without measurements and takeoffs with no items or assemblies.
Directly Enter Data
You can enter and change certain data directly on the estimate worksheet. For example, you can manually add line items and enter unit costs/quantities for them. You can also override existing quantities. This means you can add things to your estimate even if you don’t yet have quantities or measurements (no takeoff needed) and can change quantities without having to edit your takeoffs. It also means you can enter unit costs and line-item markups or override the defaults coming from your STACK Items and your Company Cost Types.
You even have the ability to directly enter measurement quants without actually measuring anything in STACK and you can edit Assembly Inputs for any assemblies directly from the Estimate Worksheet.
See Manually Enter Estimate Worksheet Data for more info.
Customize Format
You get to choose what information is shown and how it’s organized for each estimate. You can group line items, move or hide columns, filter, and sort. Once an estimate is set up the way you want, you can save that layout as a Saved View so anyone working in that estimate can quickly apply the same filters and groupings to that estimate worksheet.
Export
Estimate data can be exported to Excel with the click of a button so you can further manipulate the data, print it to PDF, or use it in another estimating/proposal software. See Export Estimate Worksheet Data for more info.
NOTE
Since rounding is handled differently, be aware that the selling price generated with the Estimate Worksheet may not exactly match the selling price on Unit Cost Estimates and Material and Labor Estimates for the same project.*
Create an Estimate
You can create multiple estimates per project.
Click on the Estimate icon next to the project on the Project List.
OR
Click the ESTIMATES tab within the project.
This will take you to the Estimate Home page.Click the green New Estimate button.
-
Select Estimate Worksheet.
The estimate worksheet will open for you to review/adjust as needed.NOTE
When reopening an estimate, STACK automatically returns to the last section that was viewed, such as the Dashboard or Worksheet. The last location is remembered across sessions, allowing work to resume where it was left off.
Each estimate card on the Estimate Home page now displays live Base Cost, Gross Margin, and Selling Price totals. These values update automatically as takeoff changes affect the estimate — no need to open the estimate to check totals.
Estimate Snapshots
A snapshot is a point-in-time copy of an estimate. It preserves the full estimate exactly as it was — totals, line items, and structure — so you always have a record of what was quoted and when. The live estimate continues to update normally; snapshots stay fixed.
Use snapshots to create checkpoints before submission, after revisions, or any time you want to lock in a version for reference.
Create a Snapshot
- Open the estimate.
- Click the three-dot menu at the top right of the estimate.
- Select Create Snapshot.
- Enter a name for the snapshot (optional).
- Click Save.
The snapshot is saved and added to the estimate's version history.
Auto-Created Snapshots
STACK automatically creates a snapshot at key moments – for example, when a project's status changes. No manual action is required. This ensures a version is always captured at critical milestones even if you don't create one yourself.
View Snapshot History
- Open the estimate.
- Click the three-dot menu at the top right of the estimate.
- Select View Snapshots.
- All saved snapshots for that estimate will be listed with their date and name.
- Click any snapshot and select Open.
NOTE: Snapshots are read-only. To make changes, return to the live estimate by clicking the arrow icon on the top left next to the estimate name.
Export a Snapshot
Snapshots can be exported to Excel alongside the live estimate, making it easy to compare versions or share a historical view.
- Open View Snapshots and open the snapshot you want to export.
- Click the three-dot menu at the top right of the estimate.
- Click Export.
- The file can be downloaded as CSV or XLS
NOTE
When a snapshot is exported, it reflects the rollup view that was active when the snapshot was taken. This ensures the exported comparison is at the correct level of detail.
Rename an Estimate
By default, when you create an estimate, it is named Estimate.
We recommend renaming your estimates so it’s easier to find the estimate you want on the Estimate Home page.
In the open estimate, click on the estimate name at the top left of the estimate.
Type in the desired estimate name.
Hit Enter on your keyboard or click outside of the text box.
The new name will be listed on the Estimate Home page.
Estimate Scope
You have the option to define the scope of an estimate. This lets you choose what data is available to view in the estimate and included in the estimate totals. You can include data based on Takeoffs, Takeoff Tags, Assemblies, Plan Sheets, and/or Labels. You have the option to include all data from a category or select individual takeoffs (those with and without measurements), tags, assemblies, plan sheets (only those with takeoffs or measurements), or labels from the project. You can include as many categories or individual selections as you'd like.
This allows you to create a very customized estimate that focuses on specific areas of interest which can be useful for many things, like breaking out the costs for alternates or phases.
NOTE
If you do not define the scope, all project data will be available to view in the estimate and will be included in the estimate totals.
If you do define the scope, data you choose not to include will not be available in the estimate and will not be included in the estimate totals. If you later want to include that data in the estimate, you will have to edit the scope.
Define the Estimate Scope
Click the Define Scope button on the green TOTALS bar at the bottom of the estimate.
-
Check the box next to the data you want included in the estimate. (Uncheck the box to exclude that data.)
Check the box next to Takeoffs, Takeoff Tags, Assemblies, Sheets, and/or Labels to include all data for the selected categories. (If a there are no Assemblies or Sheets, they will not be listed as a category to select.)
To select specific takeoffs, tags, assemblies, sheets, or labels: click the carrot icon next to a category to expand the category list and check the box next to each specific piece of data you want included.
If "None" is an option listed when you expand a category, you can select/deselect that option to include or filter out line items that don't belong to an Assembly, measurements that are not labeled, Takeoffs that are not tagged, etc.
TIP
You can quickly deselect/select all categories by clicking Deselect All or Select All and expand or collapse all categories by clicking Expand All or Collapse All. You can also use the Search bar to find a specific takeoff, tag, assembly, sheet, or label. Click Apply.
Edit the Estimate Scope
If you need to change the estimate scope, follow the instructions above and check/uncheck the boxes for information you want included/excluded from the estimate.
Columns Menu
The Columns menu controls which columns are displayed on the Estimate Worksheet. Use it to customize the worksheet view so you can focus on the quantities, costs, and pricing information relevant to your estimate.
Changes made in the Columns menu affect only the worksheet layout and do not modify item data or calculation logic.
Columns Menu Behavior
The Columns menu includes controls that make it easier to navigate and manage large sets of columns in the Estimate Worksheet.
Column groups are organized to match how columns appear on the worksheet and can be expanded or collapsed to reduce visual clutter. The menu also uses an extended height to display more options at once and minimize scrolling.
A Hide unused cost types toggle is available to help simplify the menu when working with accounts that have many Cost Types:
-
When enabled (default), Cost Types where all items have a unit cost of zero are hidden from the Columns menu, aside from the four cost types: Materiel, Labor, Equipment, Subcontract.
NOTE
The Hide unused cost types toggle only affect what is displayed in the column menu. It does not affect what is displayed in the Estimate worksheet. When disabled, all Cost Types are shown, including those used only on older or legacy estimates.
This helps keep the Columns menu focused on active Cost Types while preserving access to Cost Types used in legacy estimates.
The Columns menu uses an extended height to display more options at once, reducing the need to scroll when working with a large number of columns.
These options make it easier to manage columns in the menu without affecting estimate data or calculations.
Open the Estimate Worksheet.
Click Columns on the worksheet toolbar.
Search: (Optional) Use the Search field to find a specific column by name. (See section bellow)
Expand or collapse: Expand or collapse column groups (such as Base, Measurements, or a Cost Type) to browse available columns.
Show or hide columns: Select a checkbox to show a column, or clear the checkbox to hide it.
Select All: Select Select All to show all available columns on the worksheet.
Hide Unused Cost Types: Turn Hide unused cost types on or off to control whether Cost Types with zero unit costs appear in the Columns menu.
Autosize All Columns: Select Autosize All Columns to automatically adjust column widths to fit the displayed data.
Close the Columns menu to apply your changes.
Smart Search
The search function in STACK helps find results even without the exact text. Enter part of a word or use wildcards to expand your search.
- Enter part of a word to find matches
- Enter multiple terms to narrow results
- Use
%or*to match any number of characters - Use
_to match a single character
Examples
-
jo→ John, Joseph -
jo sm→ John Smith -
%con%→ Concrete, Precast Concrete -
jo_n→ John, Joan
NOTE%, *, and _ act as wildcards. To search for them as text, use a backslash (e.g., 50\%).
Change Column Order
It’s easy to move columns anywhere you want with a quick drag and drop.
Click on the Column Name you want to move.
While still clicking, drag the column to where you want it.
Release your mouse.
Hide/Unhide Columns
You get to decide which columns are visible on the estimate by hiding or removing columns from view. And it’s as simple as drag and drop.
Hide a Column
Click on the Column Name you want to move.
While still clicking, drag the column outside of the worksheet area.
Release your mouse.
OR
Hover over the Group column name.
Click the carrot icon that appears.
Select Hide This Column from the dropdown.
NOTE
You can also follow steps 1-2 below and uncheck the box next to the column name to hide the column.
Unhide a Column
Click Columns on the estimate toolbar at the top of the estimate.
Type the Column Name you want to see on the estimate in the Search box (or scroll down to find it).
Check the box next to the column name to include it on the estimate.
(Check the box next to Select All to make all columns visible on the estimate.)
Breakouts by Measurement Inputs
Measurement-Input Columns add an optional column grouping in the Estimate Worksheet that breaks out quantities based on the measurement inputs used during takeoff. This allows estimates to show totals for each input value—such as wall height, drop length, pitch/angle, or depth—instead of only a single combined total per takeoff.
This is especially useful when the same takeoff includes measurements created with different input values and the final estimate needs visibility into how quantities are distributed across those inputs.
How it works
When a takeoff type includes measurement inputs, an expandable column group becomes available in the Columns menu. Turning on the relevant column displays a breakdown of quantities by input value within the estimate.
For example:
Surface Area takeoffs can be broken out by wall height.
Linear with Drop takeoffs can be broken out by drop length.
Pitched Area and Pitched Linear takeoffs can be broken out by pitch (Rise/Run for Imperial projects or Angle for Metric projects).
Volume 2D takeoffs can be broken out by depth.
Volume 3D takeoffs display combinations of width and depth with corresponding volumes.
When expanded, each input value appears as its own column, showing the total quantity associated with that specific input.
When and how to use it
Use Measurement-Input Columns when a single takeoff includes measurements created with different input values and the estimate needs to show how quantities are distributed by those inputs, without changing pricing or estimate structure.
To use Measurement-Input Columns:
Open the Estimate Worksheet.
Click Columns.
Turn on the column related to the measurement-input takeoff type (such as Surface Area, Linear with Drop, or Pitched Area).
Expand the takeoff row in the worksheet to view quantities broken out by input value.
Collapse the group when the detailed view is no longer needed.
Only takeoff-level quantities are shown in these columns. Items do not display values.
Breakouts by Measurement Inputs
Measurement Input Columns allow quantities to be displayed in separate columns based on the measurement inputs used during takeoff. This makes it possible to review quantities by specific input values instead of viewing a single combined total.
This is useful when a takeoff contains measurements with different input values, such as varying wall heights, depths, slopes, or drop lengths.
For example, a single Volume 2D takeoff may contain measurements with depths of 2 ft, 3 ft, and 2 ft 8 in. When Measurement Input Columns are displayed, each depth value appears as its own column, showing the quantity associated with that specific input.
Supported Measurement Input Columns
Depending on the takeoff type, quantity breakouts may be available for:
- Surface Area — Height
- Linear with Drop — Drop Length
- Pitched Linear — Slope
- Pitched Area — Slope
- Volume 2D — Depth
- Volume 3D — Width and Depth
Display Measurement Input Columns
- Open the Estimate Worksheet.
- Click the Columns icon.
- Expand the Volumes section.
- Select the desired measurement input column.
- Review the worksheet quantities by input value.
NOTE
Measurement Input Columns display takeoff quantities only. Item quantities and costs are not separated by measurement input value.
TIP
Use Measurement Input Columns when the same takeoff contains multiple input values and additional visibility into quantity distribution is needed.
Adjust Column Size
You can adjust the size of individual columns or use Autosize to adjust the width of all columns at once.
Resize Individual Columns
Hover over the vertical dividing line to the right of the column name you want to adjust until your cursor becomes a horizontal line with arrows at the ends.
Double click and the column will automatically adjust to the width necessary to display the data it contains.
OR
Click and drag the line to manually adjust the width of the column (right to increase, left to decrease).
OR
Hover over the column name you want to adjust.
Click the carrot icon that appears.
Select Autosize This Column from the dropdown.
Autosize All Columns
To automatically adjust all columns to the width necessary to display the data they contain.
Click Columns on the estimate toolbar at the top of the estimate.
Click Autosize All Columns at the top of the dropdown.
OR
Hover over any column name.
Click the carrot icon that appears.
Select Autosize All Columns from the dropdown.
Pin Columns
You can “freeze” columns so they’re always visible and won’t scroll out of view by pinning them to either side of the estimate worksheet.
Click on the column name you want to pin.
While still clicking, drag the column all the way to the side where you want it pinned.
When you see a pin icon and the column has moved, release your mouse.
OR
- Hover over the column name you want to pin.
- Click the carrot icon that appears.
- Select PinColumn Left or Pin Column Right from the dropdown.
Multiple columns can be pinned to each side of the estimate. You can change the order of pinned columns by clicking and dragging them.
Unpin a Column
Click on the column name you want to unpin.
While still clicking, drag the column away from the side of the estimate to where you want the column located.
Release your mouse.
OR
- Hover over the column name you want to unpin.
- Click the carrot icon that appears.
- Select Unpin Column from the dropdown.
Right Click Functions
When working in the Estimate Worksheet, right-clicking on a cell opens a context menu with quick actions related to that item, takeoff, or assembly. These options help you navigate, adjust, or manage estimate data without leaving the worksheet.
Below is a description of each available option.
Add a Row: Adds a new line item directly below the selected row in the worksheet. This is useful for manually inserting additional costs or adjustments that are not tied to a takeoff or assembly.
Go to Plan: Opens the plan sheet associated with the selected item or takeoff, allowing you to quickly view or verify the original measurement source.
Reset Rate: Reverts the rate for the selected cell back to its original calculated value. This is helpful if the rate was manually overridden and you want to return to the default pricing.
Open Item in Library: Opens the selected item in the Item Library in a new tab, where you can view its details, cost data, and configuration. This option is read-only for library items you do not have permission to edit.
Open Assembly in Library: Opens the associated assembly in the Assembly Library in a new tab. From there, you can review the assembly structure, inputs, and formulas (editing depends on your permissions and library type).
Edit Assembly Inputs…: Allows you to modify the input values for the assembly used in the estimate, such as dimensions, quantities, or other configurable inputs. Changes made here update the estimate calculations accordingly.
Remove Assembly from Takeoff: Removes the assembly association from the selected takeoff without deleting the takeoff itself. This is useful if the assembly is no longer needed or needs to be replaced with a different one.
Notes
There are two types of notes you can add to an Estimate Worksheet in STACK – Estimate Notes and Line Item Notes.
Estimate Notes
These are general estimate notes for you and your team to reference. They are only accessible in the Notes section at the bottom of the Estimate Worksheet in STACK. They are not included if you export Estimate Worksheet data.
Click the Notes button on the green bar at the bottom of the estimate. (It’s next to Define Scope.)
-
Click in the box that says Write your Notes here… and type your notes.
TIP
You can move the box if needed - just click and drag using the dots at the top of the box. Click Save.
You can view notes that have been entered by clicking the Notes button on the green bar at the bottom of the estimate.
Follow the same instructions above if you need to edit or delete notes.
Line Item Note
These are notes related to specific line items. They are entered and visible in the Notes column of the Estimate Worksheet (main estimate grid and Other Costs section). These notes can be included when you export an Estimate Worksheet to CSV or XLS.
In the Notes column, click in the cell for the line item to which you want to add a note and type your note.
Follow the same instructions to edit or delete notes.
Roll Up
When an Item is associated with multiple Takeoffs, Plan Sheets, Assemblies, Item Groups, Tags, and/or Labels, data can be rolled up so it displays as a single line item on the Estimate Worksheet, or rolled out so each association displays as its own line item. Roll Up is the default when creating an Estimate Worksheet.
When data is rolled up, the associated line item cells are either:
Summed (Measured Quantity and Extended Cost), or
Copied (Unit Cost and Waste %)
If the individual line items have different values for Rate or Unit Cost, an Effective Rate or Effective Cost (denoted by an *) displays in the cell.
Effective Rate = aggregated Measured Quantity ÷ aggregated Purchase Quantity
Effective Cost = aggregated Extended Cost ÷ aggregated Purchase Quantity
In other columns where the individual line items have different values, the word Varies and an info icon displays in the cell.
Roll Ups When Ungrouping
When ungrouping an Estimate Worksheet by a field such as Zone, Plan Sheet, or Takeoff, the data automatically rolls up. This keeps the worksheet from staying in a detailed, unrolled view, which can make it look like extra or duplicate line items were added. Instead, related data is combined into a single summarized line, making the worksheet easier to read. Line items can still be rolled out manually whenever more detailed review is needed.
Roll Up or Roll Out Data
On the Estimate Worksheet, click Roll Up on the estimate toolbar.
In the Roll Up drop-down, choose how the data should display:
Roll Up — combines the data into a single summarized line.
Roll Out — displays individual line items for each association (such as by Takeoff, Plan Sheet, Zone, Tag, or Label).
Select the checkbox next to each category to include in the rollup, and clear the checkbox for any category to exclude.
Click anywhere outside the drop-down to close it.
The worksheet will update to reflect the selected view.
NOTE
When rolling up, Measured Quantity and Extended Cost are summed; Unit Cost and Waste % are copied. An asterisk (*) indicates an Effective Rate or Effective Cost because underlying line values differ. Ungrouping automatically returns the view to a rolled-up state for that grouping field.
Group By
You can group (and subgroup) line items on estimate by Takeoff, Assembly, Plan Name, Item Folder Level, Item Group, and/or any Labels you’ve applied to any measurements.
NOTE
It is not possible to Roll up and Group by the same category, including Assembly, Assembly Group, or Assembly Item Group. For example, if data is rolled up by Assembly and then grouped by assembly, the Roll Up Assembly option will be automatically deselected.
Click Group By on the estimate toolbar at the top of the estimate.
Check the box next to the category/categories you want to use to group your data.
Selecting multiple categories will create subgroups.
TIP
You can also Group by hovering over the column name (of columns that can be grouped), clicking the carrot icon that appears, and selecting Group By This Column from the dropdown.
Ungroup
If you no longer want to Group By a certain category, repeat step 1 above and uncheck the box next to that category.
Subgroups
The order in which the selected categories are displayed on the Group By dropdown menu determines the grouping order. The selected category at the top of the menu is the top-level group and the subgroup order follows the order of the other selected categories.
You can change the list order to create the Group/Subgroup order that you want.
Change the Group/Subgroup Order
Click Group By on the estimate toolbar at the top of the estimate.
Click the six dot icon to the left of a selected category on the Group By dropdown and drag it to the order on the list that you want.
Expand or Collapse Groups
You can quickly expand or collapse individual Groups or all Groups at once to suit your viewing preference.
Expand/Collapse All Groups
Click the Expand/Collapse icon on the Group column header.
OR
Hover over the Group column header.
Click the carrot icon that appears.
Select Expand All or Collapse All from the dropdown.
Expand/Collapse an Individual Group
Click the carrot icon to the left of the specific Group name.
Markup vs. Margin in the Estimate Worksheet
Columns
STACK supports both Markup and Margin so estimates can be priced using the approach that best fits your company’s workflow. While both methods increase costs to reach a final price, they describe profit in different ways.
Markup represents profit added on top of cost.
Margin represents profit as a portion of the final price.
Although the percentages differ, both approaches can result in the same final total.
Example
Starting cost: $100
A 25% markup results in a total of $125
A 20% margin also results in a total of $125
Profit Markup %
The Profit Markup % column represents how much profit is added to the base cost.
This approach answers the question: How much should be added to this cost?
Example
A concrete slab has a material and labor cost of $10,000. Applying a Profit Markup of 25% adds $2,500 in profit, resulting in a total price of $12,500. In this case, profit is calculated directly from the cost and added on top.
Cost: $10,000
Markup: 25%
Profit calculation:
$10,000 × 25% = $2,500
Total Price:
$10,000 + $2,500 = $12,500
NOTE
Profit is calculated as a percentage of the cost and then added on top.
Markup is commonly used when pricing starts with known costs and a percentage is added to cover profit.
Profit Margin %
The Profit Margin % column represents how much of the final price is profit.
This approach answers the question: What portion of the final price should be profit?
Example
The same concrete slab has a cost of $10,000, but the estimate is priced to achieve a 20% margin. STACK calculates the total price as $12,500, where $2,500 of that total represents profit. Here, profit is defined as a percentage of the final price rather than the cost.
Cost: $10,000
Margin: 20%
Total price calculation:
$10,000 ÷ (1 − 0.20) = $12,500
Profit calculation:
$12,500 − $10,000 = $2,500
NOTE
Profit is calculated as a percentage of the final price, not the cost.
STACK automatically converts the margin percentage into the appropriate dollar amount and applies it to the estimate.
Using Markup and Margin Together
Markup and Margin are designed to work together within the same estimate. Values can be entered in the Profit Markup % column, the Profit Margin % column, or both, depending on how pricing is being applied. Regardless of which column is used, STACK combines the results into the same profit totals, ensuring profit is calculated consistently across the estimate.
These columns follow the same linked-cell behavior as other cost-related fields, helping keep values aligned when items share the same cost type. This allows estimates to support different pricing strategies without requiring manual conversions.
Margin in Other Costs
Other Costs (such as bonds, permits, fees, or allowances) can also be priced using either Markup or Margin, just like items in the main estimate. In the Other Costs table, Markup % is used when profit is added on top of the base cost, while Margin % is used when profit is defined as a portion of the final amount.
A value may be entered in either column, and STACK calculates the profit automatically. Regardless of which method is used, the calculated profit is included in the total for that Other Cost category, ensuring pricing remains consistent with the rest of the estimate.
Filter Data
You can filter data in any column and can apply filters to multiple columns to remove data from view on the Estimate worksheet so you can focus on specific areas of interest. Filter options (text/number) for each column depend on the type of data they contain.
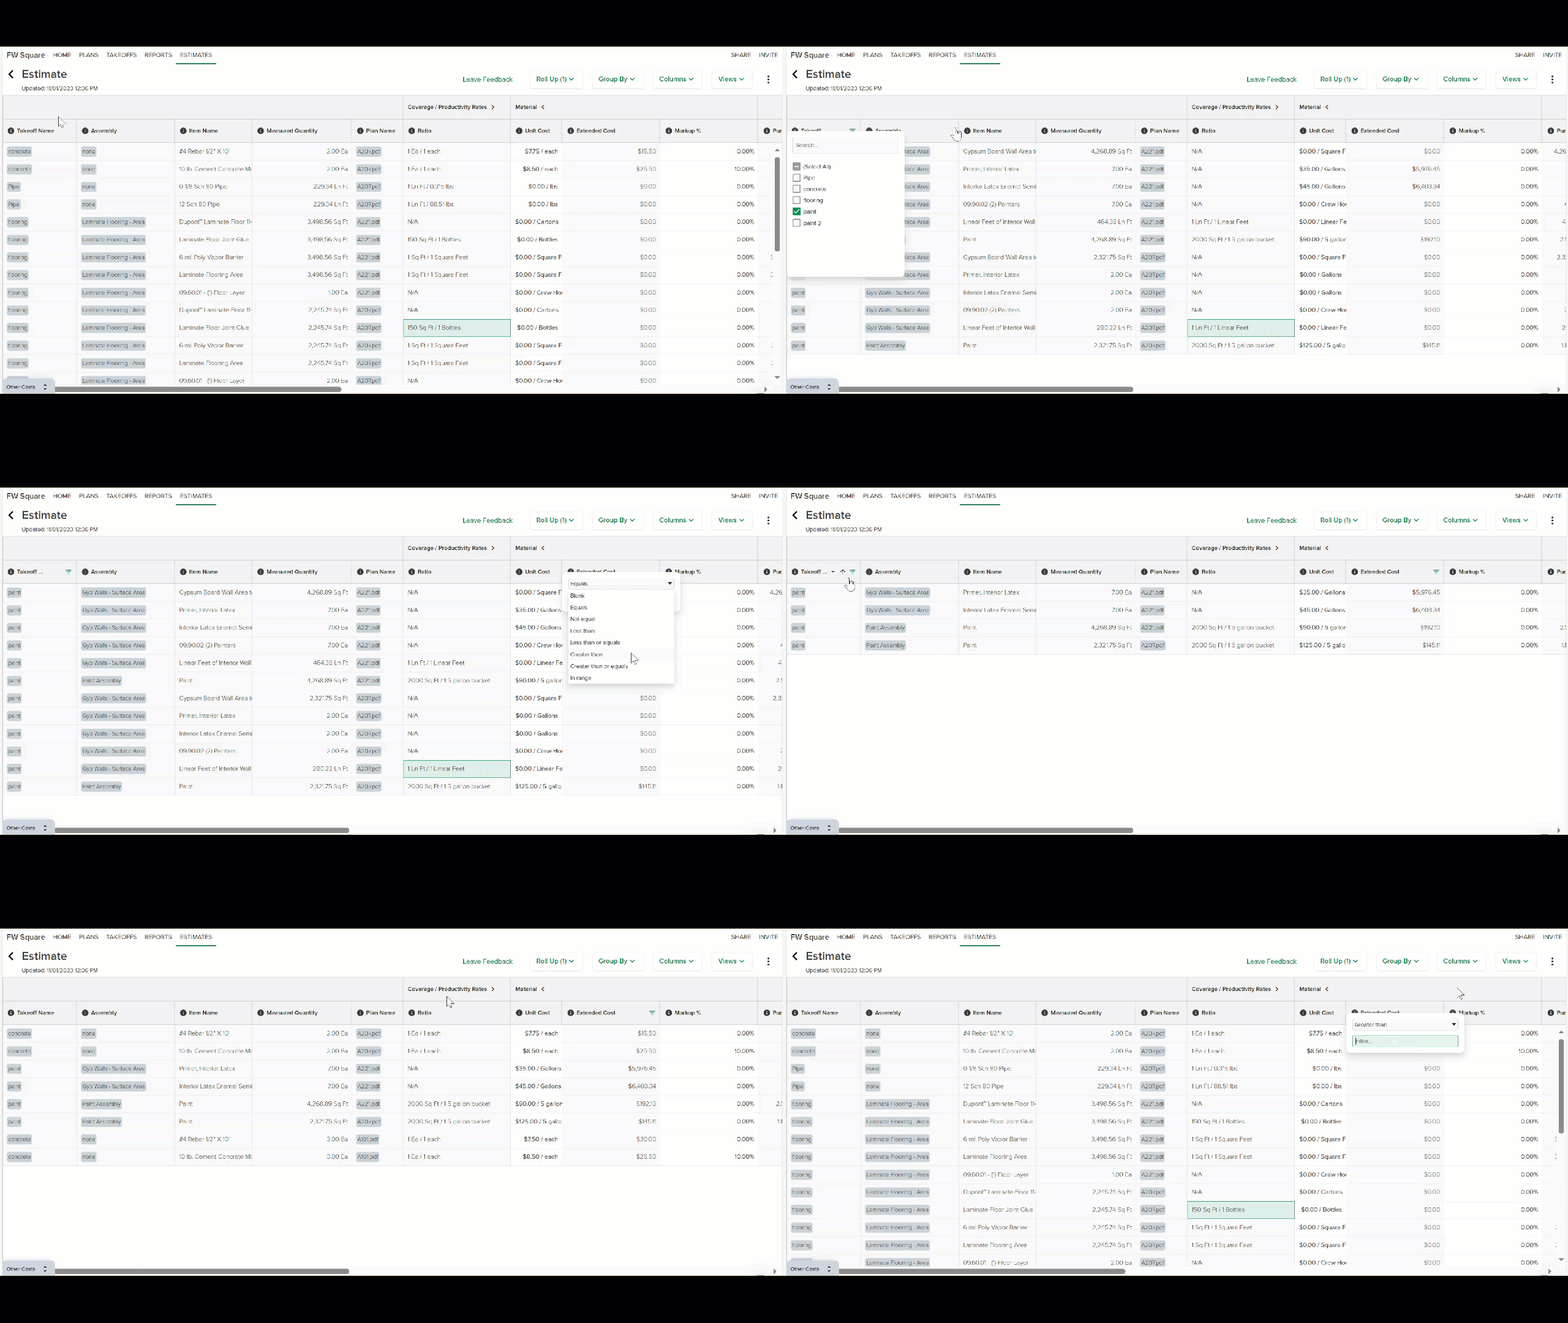 Apply Filters
Hover over the column name you want to filter.
Click the Filter icon that appears to the right.
Select the filter option you want.
Depending on the column, there may be checkboxes or a dropdown menu from which to select.
If you selected from a dropdown menu
- Type the data you want returned in the Filter…box.
- If you want to apply a second parameter to the filter -
Click AND for results that include both.
OR
Click OR for results that include either. - Open the second dropdown menu and select the filter option you want.
- Type the additional data you want returned in the Filter…box.
Click outside of the filter window to close it.
A funnel icon is displayed next to the column name when a filter is applied.
Remove Filters
Click the Filter icon to the right of the column name from which you want to remove the filter.
Delete/clear the data in the Filter…box(es).
Click the top of the filter window to close it.
Sort Data
Estimates can be sorted by the data in any column, and you can sort by multiple columns.
If a column is currently sorted, an arrow will be displayed next to the column name.
Hover over the column name you want to sort.
Click the arrow that appears to the right of the column name once to sort the data from smallest to largest.
An arrow pointing up will appear next to the column name.Click the arrow again to sort from largest to smallest.
An arrow pointing down will appear next to the column name.Click the arrow again to stop sorting.
No arrow will be displayed.
To sort by an additional column(s), hold the shift key and repeat the steps above for each additional column you want to sort.
Estimate Preferences
Estimate Worksheet Preferences allow users to control how certain calculations are performed. Preferences are set at the estimate level and can be adjusted as needed to match performance requirements or calculation methods.
Defer Calculation of Distributions from Other Costs
This preference controls when distributions from the Other Costs section are recalculated.
When checked: Distributions are only recalculated on demand, rather than automatically. This improves performance for large or complex estimates.
When unchecked (default): Distributions are recalculated automatically whenever values in Other Costs are updated.
Measured Unit Price Based on Takeoff Quantity
This preference changes how the Measured Unit Price is calculated for line items.
-
When checked: The Measured Unit Price is calculated using the Takeoff Quantity (the primary measurement for the takeoff) rather than the item’s unit of measure. The value displays with the takeoff’s unit of measure (e.g., SF, EA).
Example: For clips measured in Each (EA), the unit price can be shown relative to the panel’s square footage (SF), not the count of clips.
When unchecked (default): The Measured Unit Price is calculated based on the item’s unit of measure, as it works today.
This option ensures flexibility in displaying Measured Unit Price without changing calculations for all users.
To update your Estimate Worksheet preferences, click on the three dots at the top right.
Select Preferences.
-
Check the box for the preference you wish to apply:
Defer calculation of distributors from Other Costs
Measured Unit Price always based on Takeoff Quantity
Click Save.
The Estimate Worksheet will automatically update to display your selected preference.
Coverage Rate
The Rate column shows the coverage rate for each item you’ve added to your takeoffs as the ratio of measured coverage and measured unit to purchase coverage and purchase unit.
(E.g., If the item is paint, the ratio might be 350 Sq Ft / 1 Gallon)
You can view and edit coverage rates directly in your Estimate Worksheet.
Edit the Rate
NOTE
You can only edit if the cell has a white background and you can only edit the amounts, not the unit types.
Double click in the Rate cell for that item.
Type in a new Measured Coverage and/or Purchase Coverage amount.
Hit enter on your keyboard.
TIP
You can use your keyboard to easily maneuver - use the tab key move from measured coverage to purchase coverage and the arrow keys to move from one line item to the next.
The Rate can also be changed by changing the Purchase Quantity. If you manually enter data in the Purchase Quantity cell for a line item, the Rate will automatically recalculate based on the new Purchase Quantity data.
NOTE
Edits you make to the measured coverage or purchase coverage data on the Estimate Worksheet are only applied to the estimate. The item information in the Item Library is not updated.
Reset the Rate
If you have changed the Rate and want to revert back to the original Rate for a specific line item, right click on that item's Rate cell and select Reset Rate or Reset Rate to Assembly Formula.
If you want to revert back to the original Rate for all line items, click the carrot icon that appears when you hover over the Rate column header and select Reset all Rates in column.
NOTE
If your takeoffs have items that are not part of an assembly and you change your project's measurements from imperial to metric or vice versa, you will need to follow the follow the instructions above to Reset all Rates in column so STACK can convert the data in the Rate column to the appropriate measurement system to provide accurate Purchase Quantity data.
Adjust Rates for Items with Assembly Formulas
Items that use Assembly formulas calculate their rates automatically, which means the Rate may appear locked when working in the Estimate Worksheet. The effective coverage rate can still be adjusted directly without changing the formula.
- Locate the Item in the Estimate Worksheet.
- Double-click the Rate cell.
- Enter the updated Measured Coverage and/or Purchase Coverage.
- Press Enter.
To keep values consistent, the same adjustment can be applied across matching Items:
- Right-click the updated Rate cell.
- Select the option to apply the change to matching Items.
These changes apply only within the estimate and do not modify the underlying Item or Assembly.
Adjust Item Formulas
Items that use Item Formulas calculate purchase quantities using a formula instead of a standard Coverage Rate. Item Formulas can be edited directly from the Estimate Worksheet.
- Locate the item in the Estimate Worksheet.
- Click the formula icon.
- Apply changes and click Save.
The Purchase Quantity updates automatically.
NOTE
Changes made to an Item Formula in the Estimate Worksheet are reflected in the associated takeoff.
Search Item Group Options
When selecting an Item from an Item Group, a search field is available at the top of the list. This makes it easier to find specific options in large Item Groups without scrolling through every available Item.
To search within an Item Group:
- Open the Item Group selection list.
- Click in the search field at the top of the dropdown.
- Enter part of the Item name, supplier name, product type, size, or other keyword.
- Select the desired Item from the filtered results.
The list updates automatically as text is entered, showing only matching Items.
TIP
Search is especially useful for Item Groups that contain vendor-specific products, material options, or large numbers of Items. Entering a few characters can quickly narrow the list and reduce selection errors.
Rounding of Estimate Worksheet Data
Quantities
It is likely you will have some quantities on the Estimate Worksheet that are decimals. Quantities are NOT automatically rounded to the nearest whole number so you can see what the actual measurements/counts are for each line item and to ensure accurate calculations when items are rolled up, rolled out, and grouped in different combinations.
If you want to use a whole number to calculate your estimate totals, you have the ability to round the Purchase Quantity of individual line items, groupings, or all line items in the Purchase Quantity column. You can also manually enter a quantity in the Purchase Quantity field of any line item. The rounded or manually entered Purchase Quantities will be used to calculate everything (Rate, Extended Costs, Markup, Base Costs) needed to determine the total estimate SELLING PRICE.
Round Purchase Quantity by Line Item
In the Purchase Quantity column, select the cell for each line item quantity you want to round.
Right click on the cell and select Round Purchase Quantity from the menu.
Round Purchase Quantity by Group
TIP
If you export your estimate to proposal, we recommend that you round the quantities by group right before you export and use the same groupings you plan to use when exporting.
If your estimate is grouped by any category, in the Purchase Quantity column, select the header cell for each Group you want to round.
Right click on the cell and select Round Purchase Quantity from the menu.
The quantity for all line items in the selected Group(s) will be rounded.
Round All Purchase Quantities
- Hover over the Purchase Quantity column header and click the carrot icon that appears.
- Select Round all Purchase Quantity in column from the menu.
The quantity for all line items in the column will be rounded.
Round Purchase Quantities up to the Nearest Increment
The Round Up to Purchase Increment option in the Estimate Worksheet adjusts purchase quantities so they match the way materials are actually sold. For items that can only be bought in set amounts—like pipe that comes in 18.25-foot lengths—this option rounds the total quantity up to the nearest allowed increment, based on the item’s settings in the Library. It works anywhere rounding can already be applied, including individual cells, multiple selected cells, column menus, and group headers in the Purchase Quantity column.
Right click on an item.
Select Round to item increment.
The specific item will be rounded to the nearest increment, in accordance the purchase coverage.
Dollar Amounts
Dollars amounts are calculated based on a quantity multiplied by some dollar/cents input. This rarely results in an amount with exact cents at two decimal places. For example, 25.67 sf x $15.43 = $396.0881.
STACK maintains all dollar amounts to 8 decimal places in our database and rounds them to the nearest penny for display in the Estimate Worksheet. So, in the above example, we keep $396.0881 in the database, but you see $396.09 on the Estimate Worksheet. This allows us to
Occasionally this results in what appears to be a calculation error, because if you add the displayed (rounded) values together, they sometimes don’t match the total we display, which is rounded based on the 8 decimal place amount database calculations. The differences are rarely significant but are something to be aware of.
Example:
This process actually allows us to calculate more accurate totals while presenting data in the most useful format. Most applications, including Microsoft Excel and Google Sheets, function in this way – maintaining unrounded numbers in the database and rounding at the last minute to display a relevant dollars and cents value.
Other Costs
Other Costs allow additional expenses outside of standard line items to be included in an estimate, such as overhead, sales tax, contingencies, profit, or other direct and indirect costs. These costs can be added as lump sums or percentages and distributed across line items or kept as separate entries. Visit the Estimate Worksheet Data Explained article to get more detailed information.
Other Costs Templates
Other Costs Templates help teams consistently add and price non-takeoff costs across estimates. They’re ideal for recurring items like permits, bonds, fees, allowances, general conditions, or subcontractor costs that aren’t measured from plans. Creating these costs once in a template saves time, improves accuracy, and keeps estimates consistent.
Open an Estimate Worksheet.
Click the equal sign in the Other Costs section to expand.
Make sure to add all the relevant other costs and column details that you want to include in the template.
Click the Templates drop down to the right of Other Costs.
Click Save Template.
Enter the Template Name.
Check Auto-add this Template to all new Estimates to automatically add the newly created template in all future estimates, without having to select it from the Templates dropdown.
Click Save.
Applying a Cost Template
Open an Estimate Worksheet.
Click the equal sign in the Other Costs section to expand.
Click the Templates drop down to the right of Other Costs.
Select the template that you want to apply to the Other Costs section of your Estimate worksheet.
Editing or Deleting an Other Cost Template
Open an Estimate Worksheet.
Click the equal sign in the Other Costs section to expand.
Click the Templates drop down to the right of Other Costs.
Click the trash can icon to Delete an Other Costs Template.
Click the pencil icon to Edit an Other Costs Template.
Make any required edits and click Save.
Related Articles
Add or Delete Additional Costs from an Estimate Worksheet
Manually Enter Estimate Worksheet Data
Save and Apply Views
Export Estimate Worksheet Data
Unit Cost Estimate / Material and Labor Estimate Overview
See how others use this feature in the STACK Community.
If you need additional assistance, please Contact Us.
Comments
Please sign in to leave a comment.